Chrome DevTools has over 30 panels, catering to the needs of millions of web developers over the last 10+ years.
There are a subset of DevTools panels that were designed to help these performance experts with this optimization work. I led several waves of research to understand how web performance experts used DevTools in their workflows to identify, debug, and optimize performance.
Within 6 months, my work led to a clearer understanding of who web performance experts were, what needs they had, and identified high-level critical journeys with 8 key themes of pain points — opportunities of improvement that became feature sets and strategic milestones launched by our developer team.
Since 2023, the DevTools team has been iterating and launching these insight-driven features and milestones for the Performance Panel and refining the developer experience by deprecating unused / redundant features.
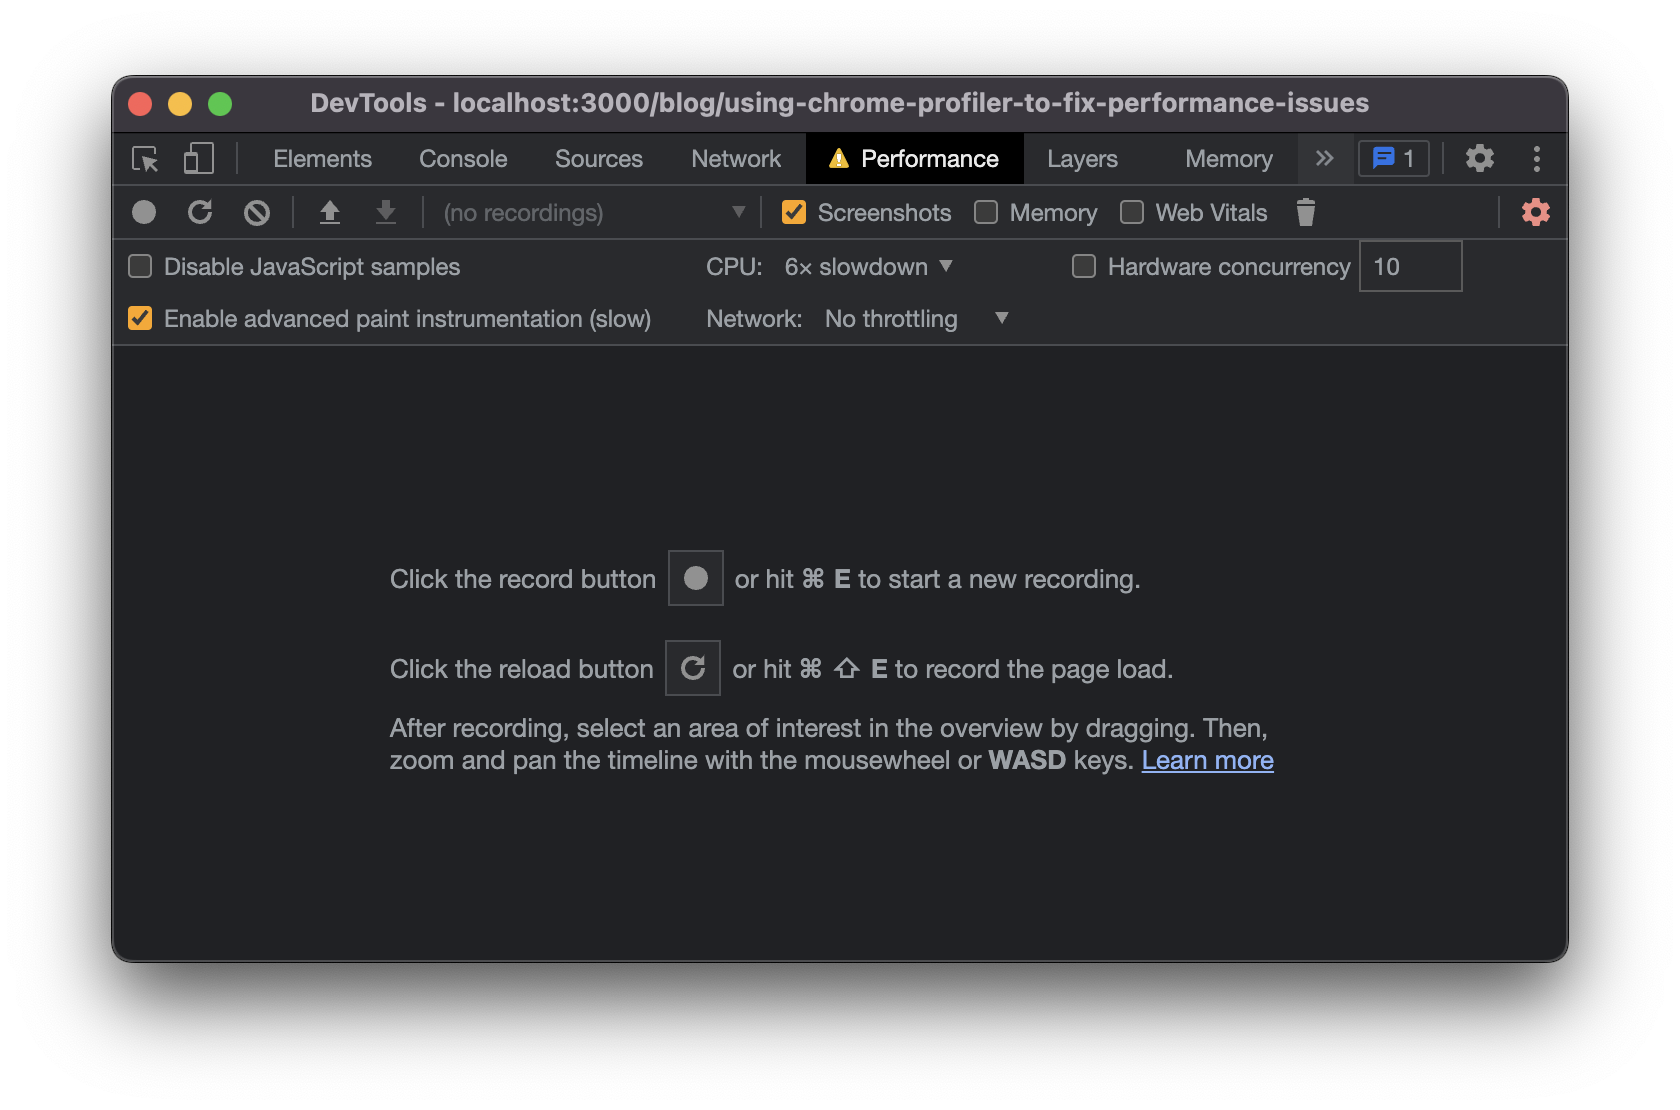
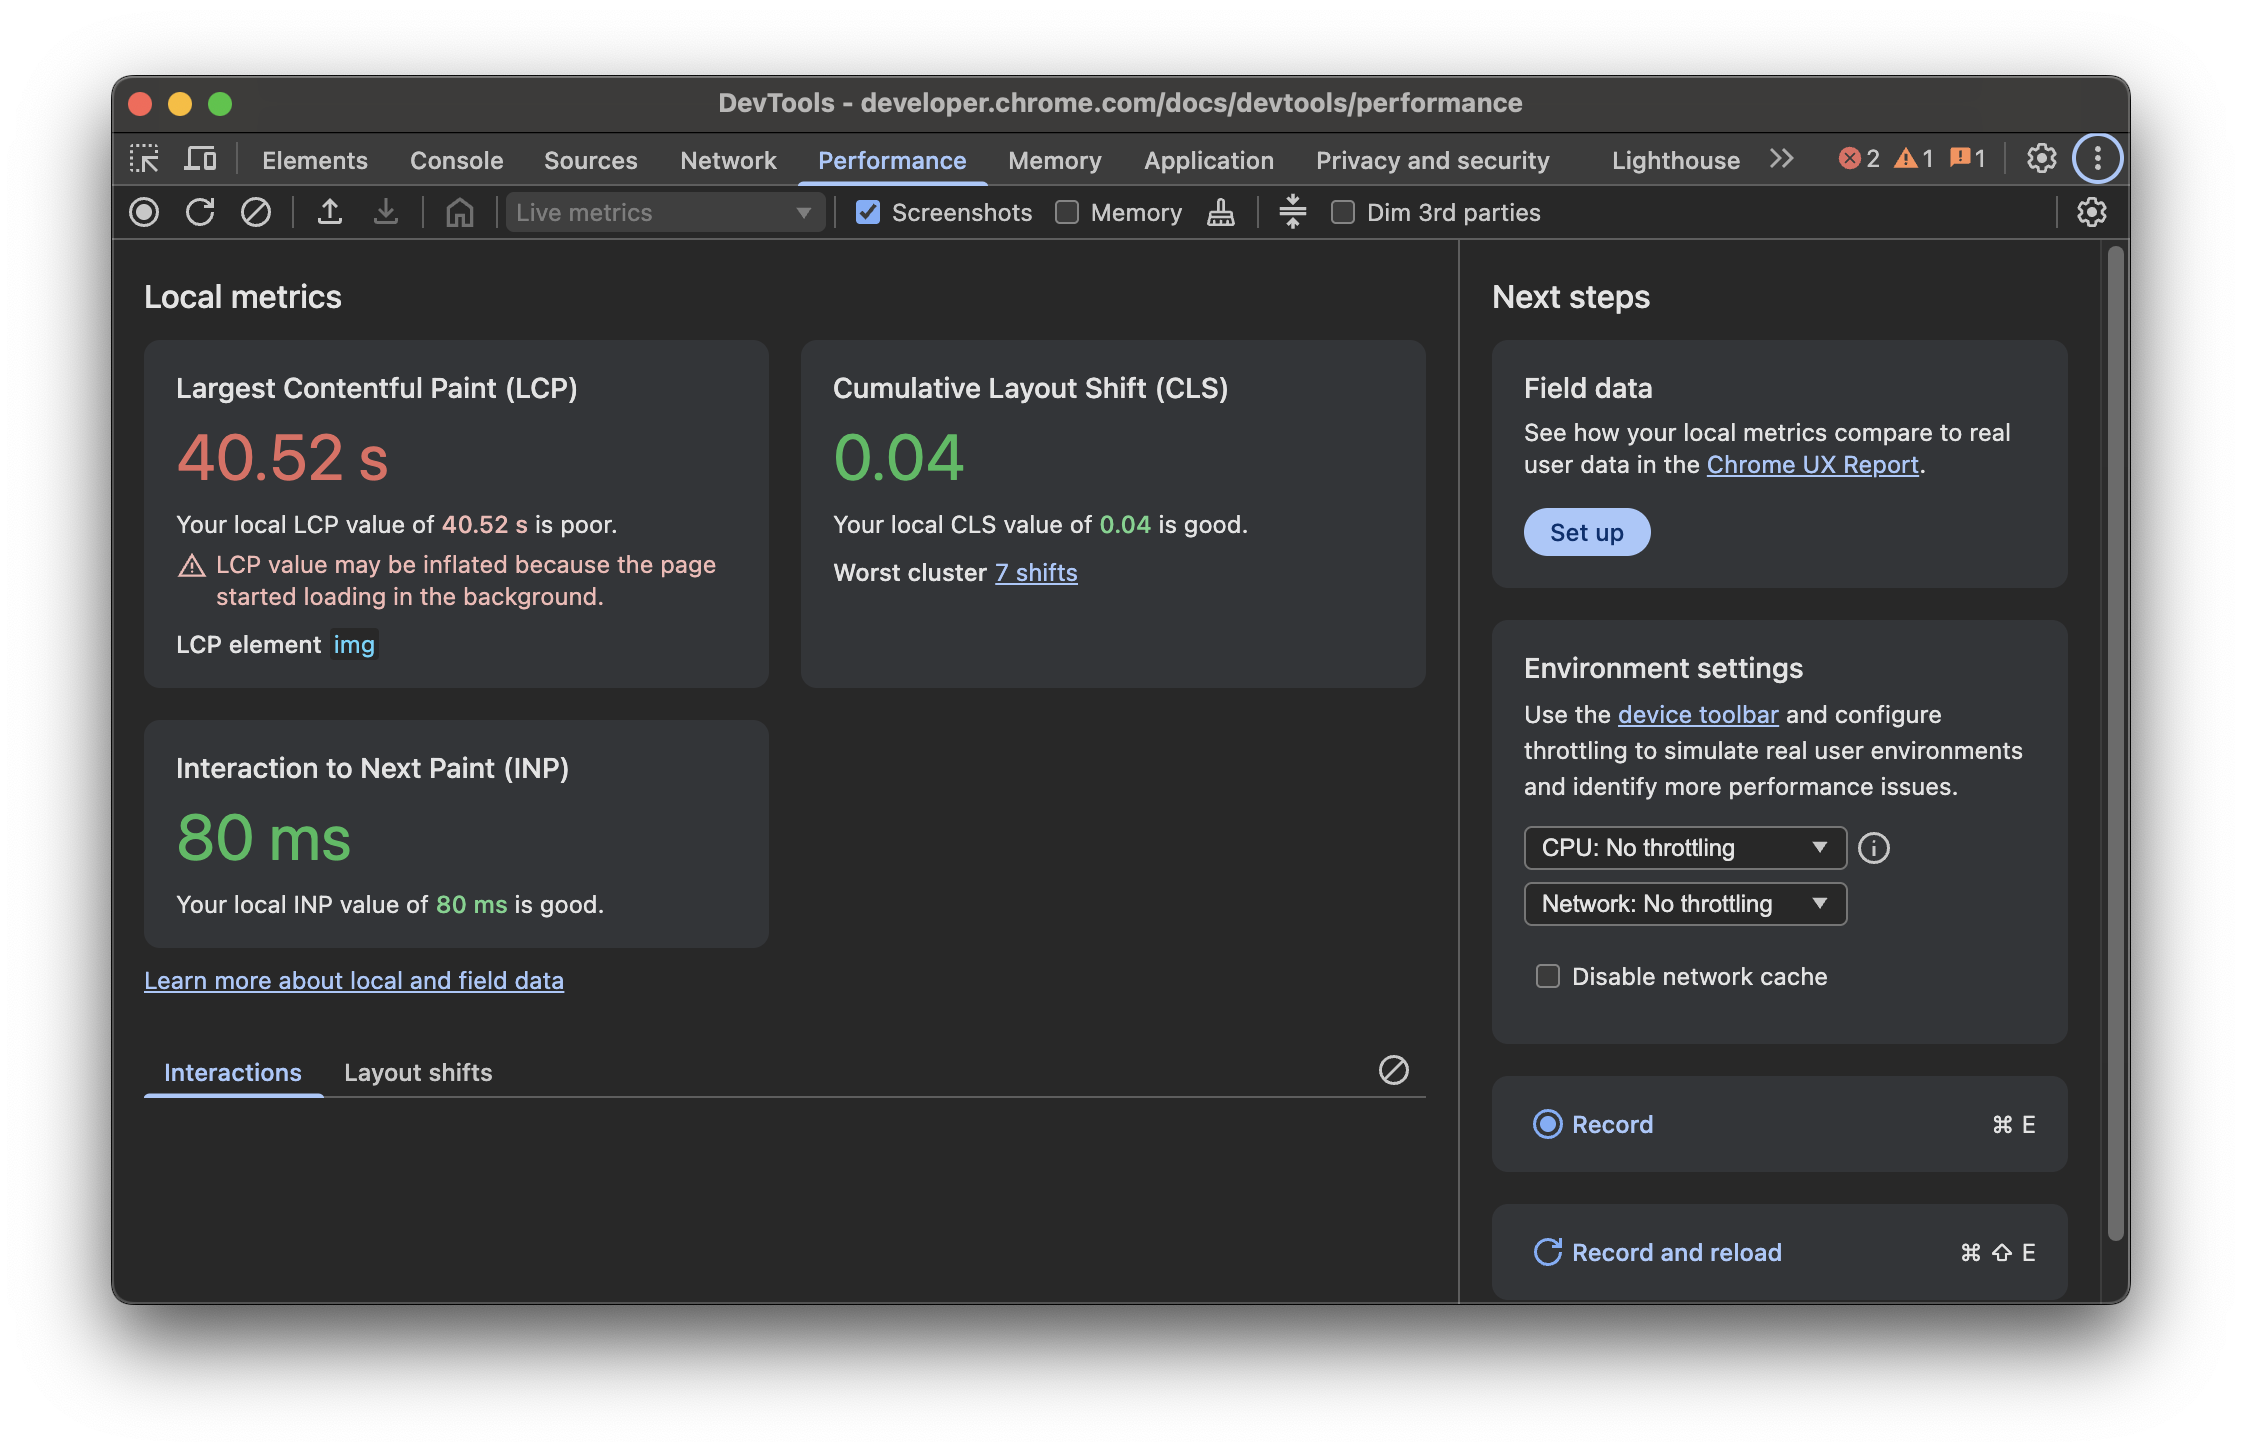
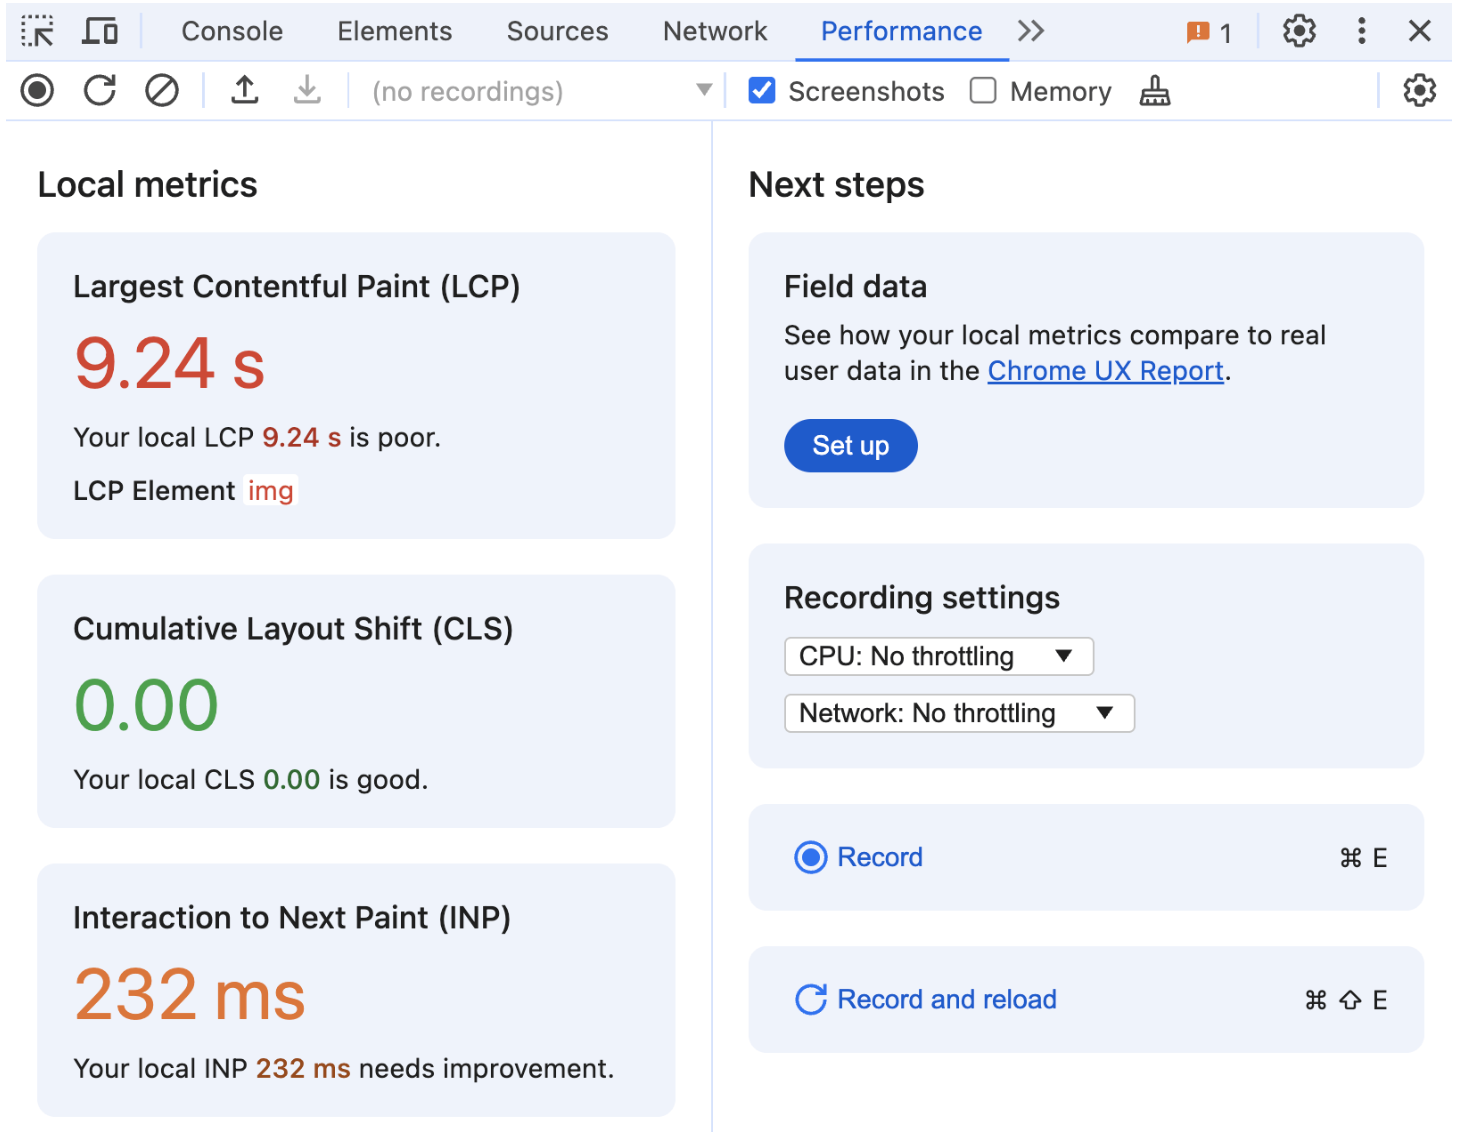
Performance Panel’s landing page / empty state
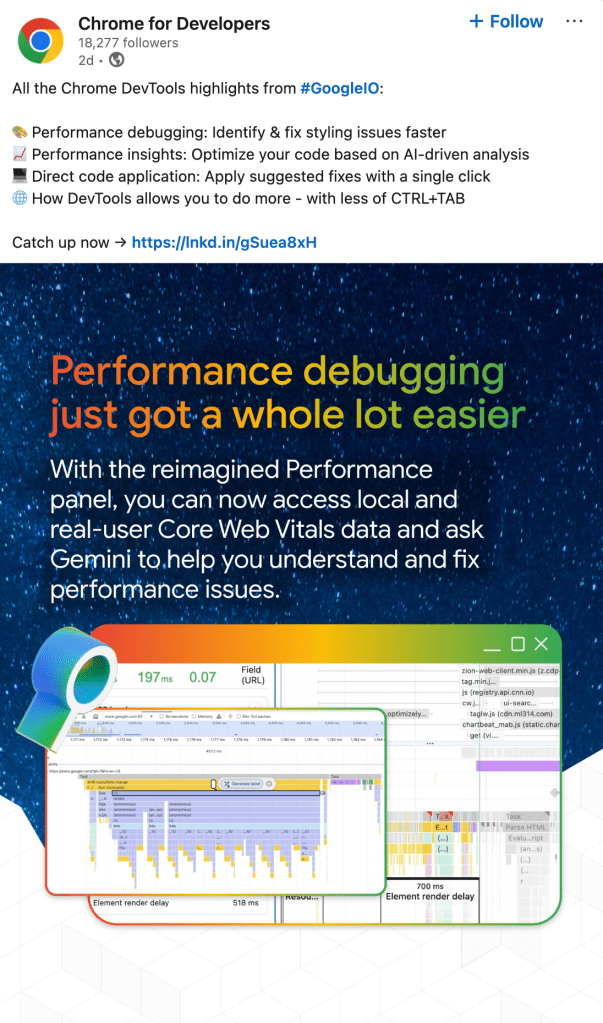
New features & updates have been documented in Chrome DevTools blogposts:
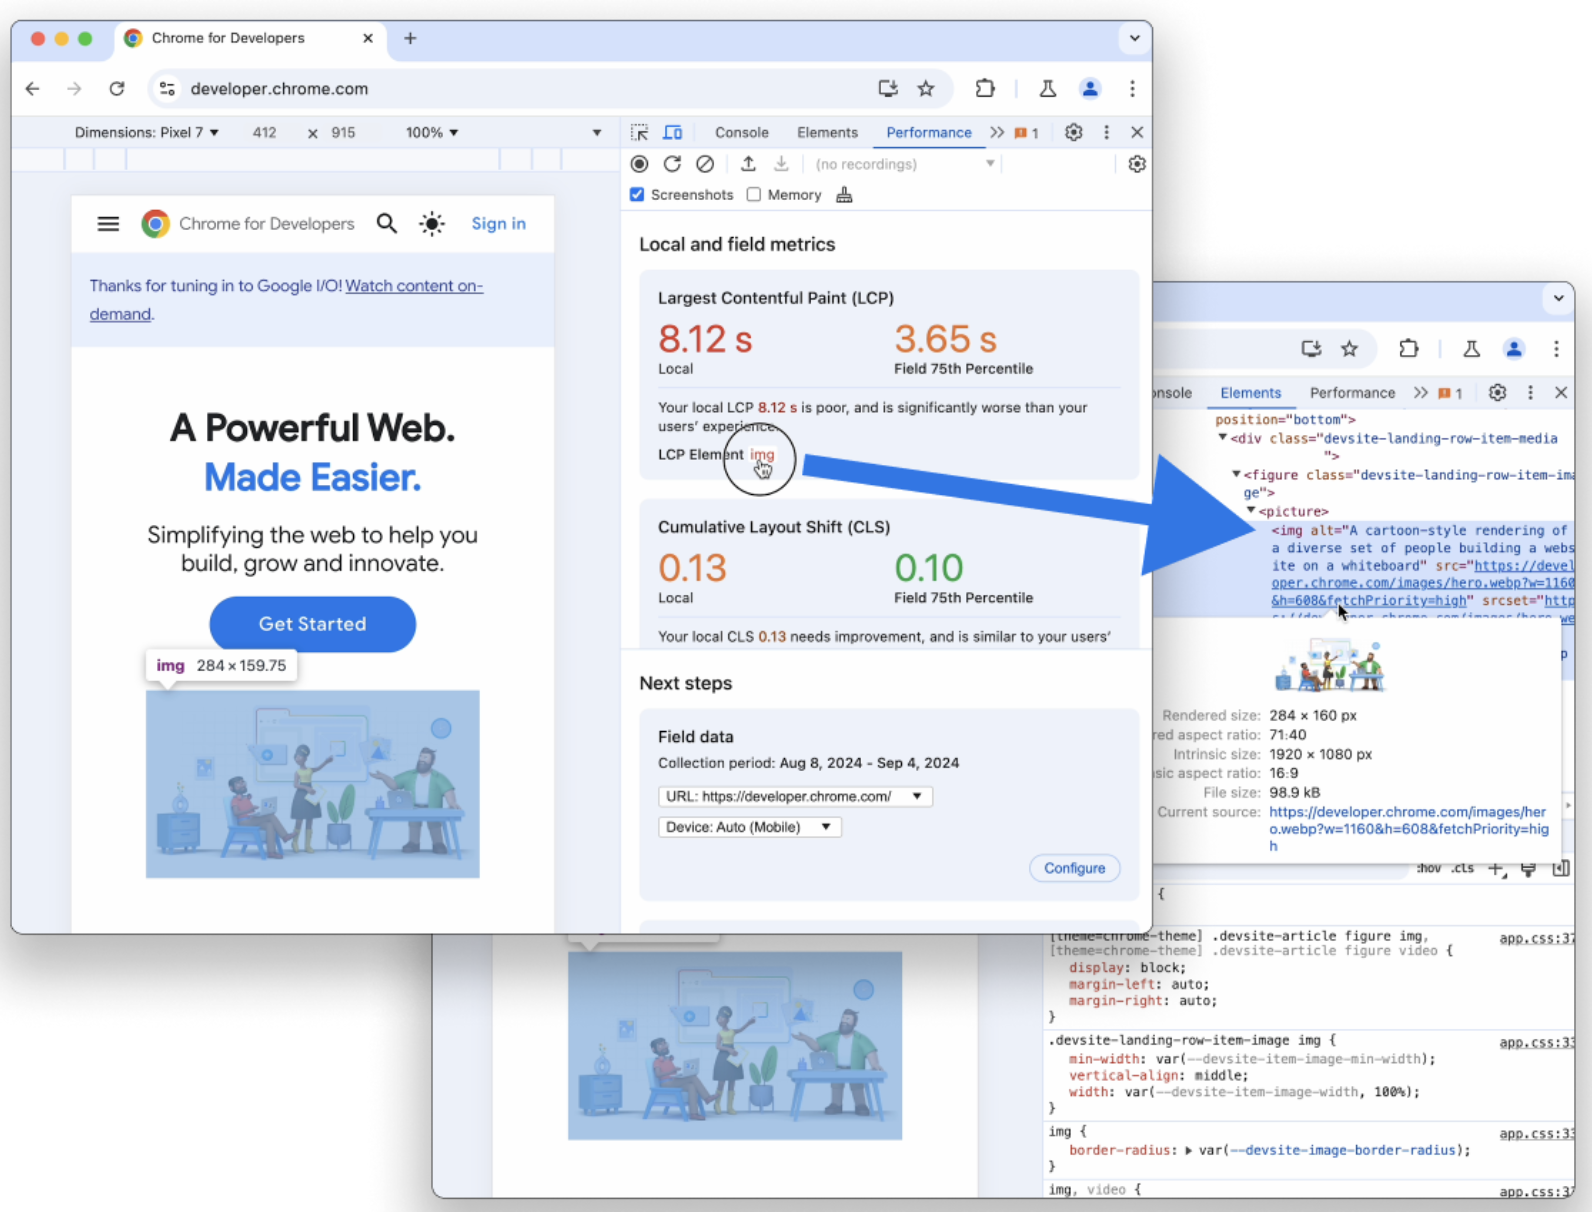
- New landing page with live view of metrics
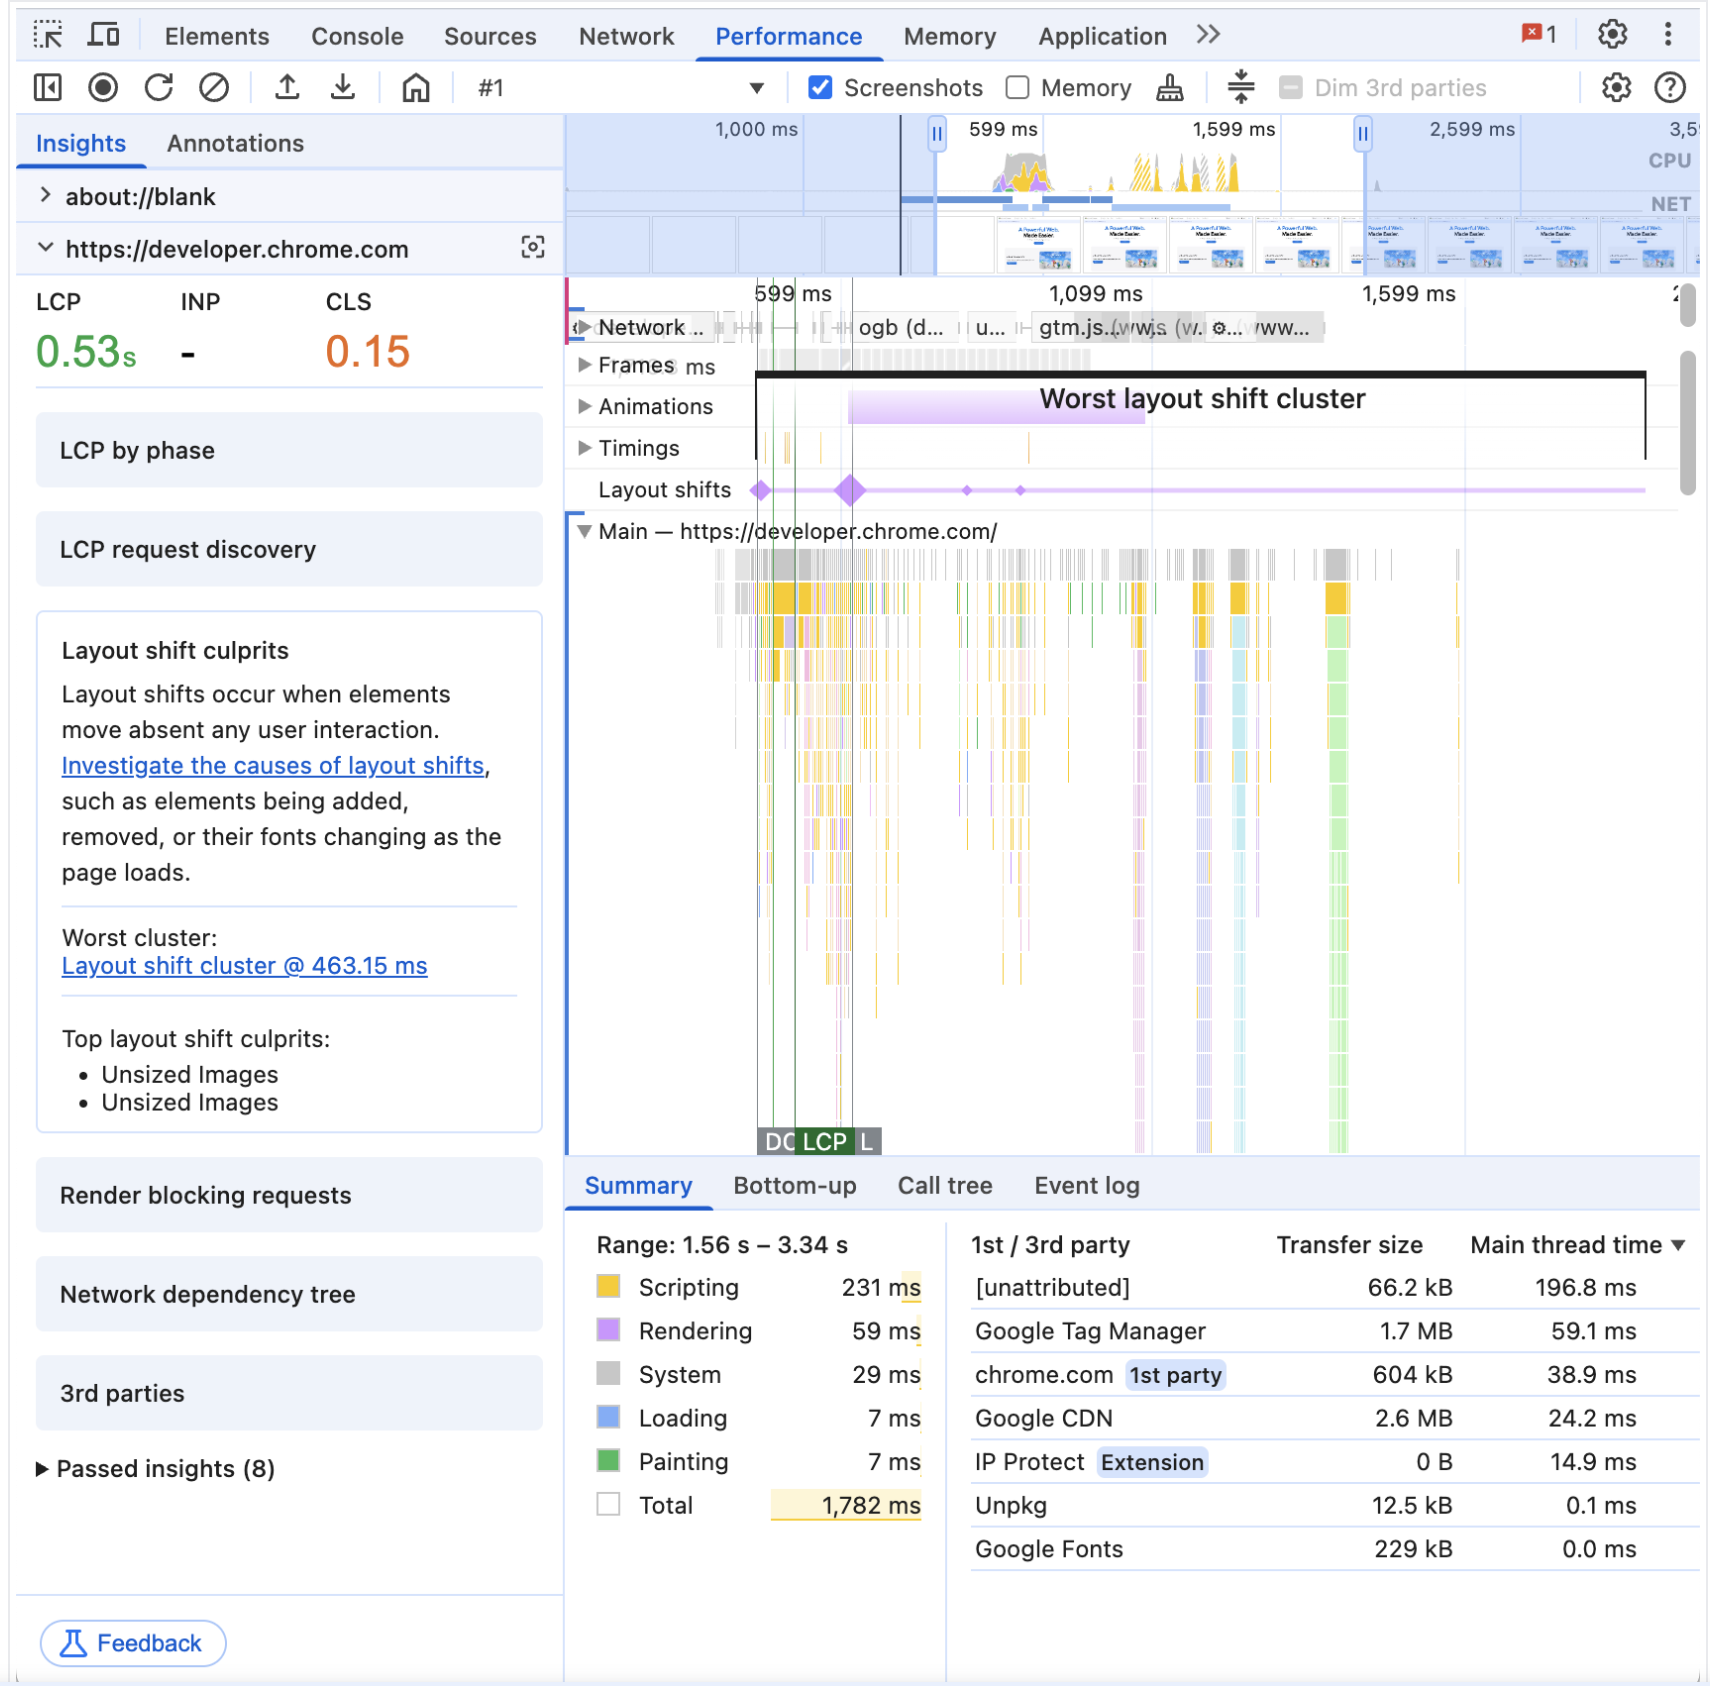
- New Insights Sidebar
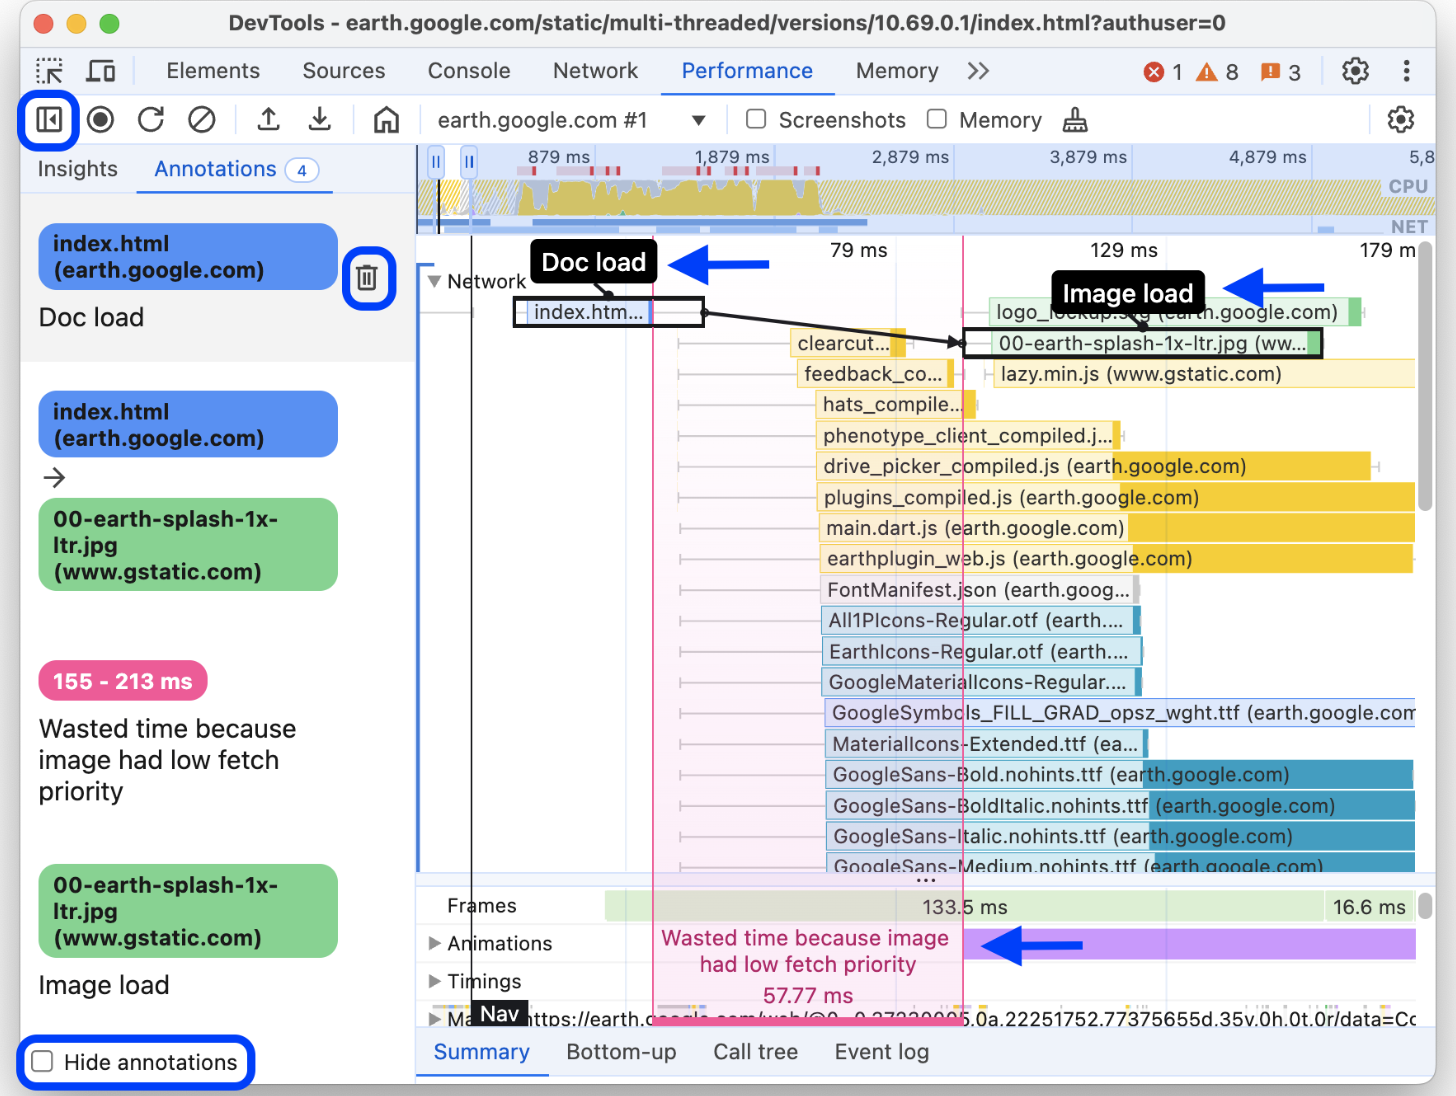
- Annotate & Share Performance Traces
- Deprecation of “Performance Insights”
- Improved info navigation & filtering
- Merging real-time extension data
- Improved accuracy & real-world data
Deep Dive
*Please note that my reports and deliverables were not shareable externally, but I am happy to answer questions in person if possible*
Context & Planning:
In 2021, before I joined the Chrome team, an experimental DevTools panel for web performance (“Performance Insights“) was created. After receiving feedback, the team wanted to explore merging it with the existing legacy Performance Panel (originally “Timeline” when it first appeared 10+ years ago)to streamline performance-related features.
I was originally tasked to uncover risks and identify mitigations for reconciling these two panels, but instead advocated and gained stakeholder buy-in to expand research scope for a deeper understanding of developer needs, as we lacked foundational insights beyond internal expertise and anecdotal feedback.
Our key research questions were:
- Who are our “expert” web performance users?
- What guiding metrics or goals do they rely on when working on web performance?
- How aligned are pain-points, workflows, and needs?
- What are the most significant pain points and workflow frictions that they encounter?
- Which DevTools panels do they most rely on for their work? Why?
- What benefits if any, do they perceive the “Performance Insights” panel to provide over the “Performance” panel?
Method and Execution:
As this was a specialized technical space, I conducted preliminary research with 5 internal Subject Matter Experts — in-house developer experts and engineers with 10+ years of experience — to gain a clearer understanding of the area and the panel’s functionalities. Learning about the complexity and technical terms around web performance led me to structure the research into two distinct phases.
First, I ran small group interviews with 11 industry experts to determine how they define and measure performance. The moderated structure and group setting invited participants to build on each others ideas and feedback in a short amount of time. This also helped pinpoint common issues and recurring themes across teams in different industries, maturity levels, and types of products, and familiarized me with the terminology required to engage effectively with experts.
Following these initial insights, I developed comprehensive moderation scripts for a phase of in-depth expert interviews with 14 participants. These focused on panel-specific workflows, key challenges, and “blue-sky” ideation around the ideal workflows and features.
Analysis:
Interview notes were systematically de-identified (removing PII and other identifiable details where appropriate) compiled into a qualitative thematic “coding” spreadsheet, where I tagged and organize quotes and insights by their themes and topics.
During analysis, I also began to define phases of their performance journeys, and thematic categories in user feedback.
This spreadsheet continued to served as a durable resource — referenced for other product questions and features well beyond a year after the initial research was completed.
Outcomes & Impact:
Our foundational understanding of web performance developers and their priorities was significantly improved, leading to several key realizations:
- “Performance” is a broad term with varying interpretations depending on user groups and the complexity of issues, thus impacting which metrics are most relevant.
- A high-level journey for performance workflows was mapped, illustrating how different tools and pain points fit within it.
- Insight into the use cases, strengths, and weaknesses of DevTools panels (beyond Performance & Performance Insights) and alternative tools outside of the Chrome ecosystem was gained.
- Eight key pain points and opportunity themes emerged, reflecting specific feedback on feature requests and usability issues.
I shared topline reports for leads, detailed readouts for the broader DevTools team, and worked closely with UXD on structuring a strategic ideation workshop with cross-functional teammates.
This workshop enabled our team of product managers, engineers, in-house developer experts, and designers to actively brainstorm, iterate, and establish a high-level roadmap for the subsequent two years of Performance Panel and cross-DevTools improvements.
Notable examples of pain points that were surfaced and addressed were:
- Inter & Intra-panel context-switching: There were several instances of back-and-forth switches to access key information and features within & between the Performance Panel and other panels in DevTools. This caused frustration & friction, with several repetitive moments to access information that was key to continue workflows. We reduced this by looking at ways to move and provide in-context info through the new Insights Sidebar, new Live View landing page, tooltip hovers (ex.), shortcuts to switch & jump to information, and in some cases reorganizing the information architecture to better surface information(ex.).
- Annotating & Sharing Traces: Although performance debugging was a niche and siloed workflow, performance solutions often required cross-functional collaboration. Performance experts would often take screenshots of the performance trace, and use other tools (even sometimes printing them out!) to layer notes and create documentation for themselves and teammates. We took note of commonly used note-taking forms and values to provide an in-line annotation feature, and added the ability to share links to traces for more frictionless collaborations.
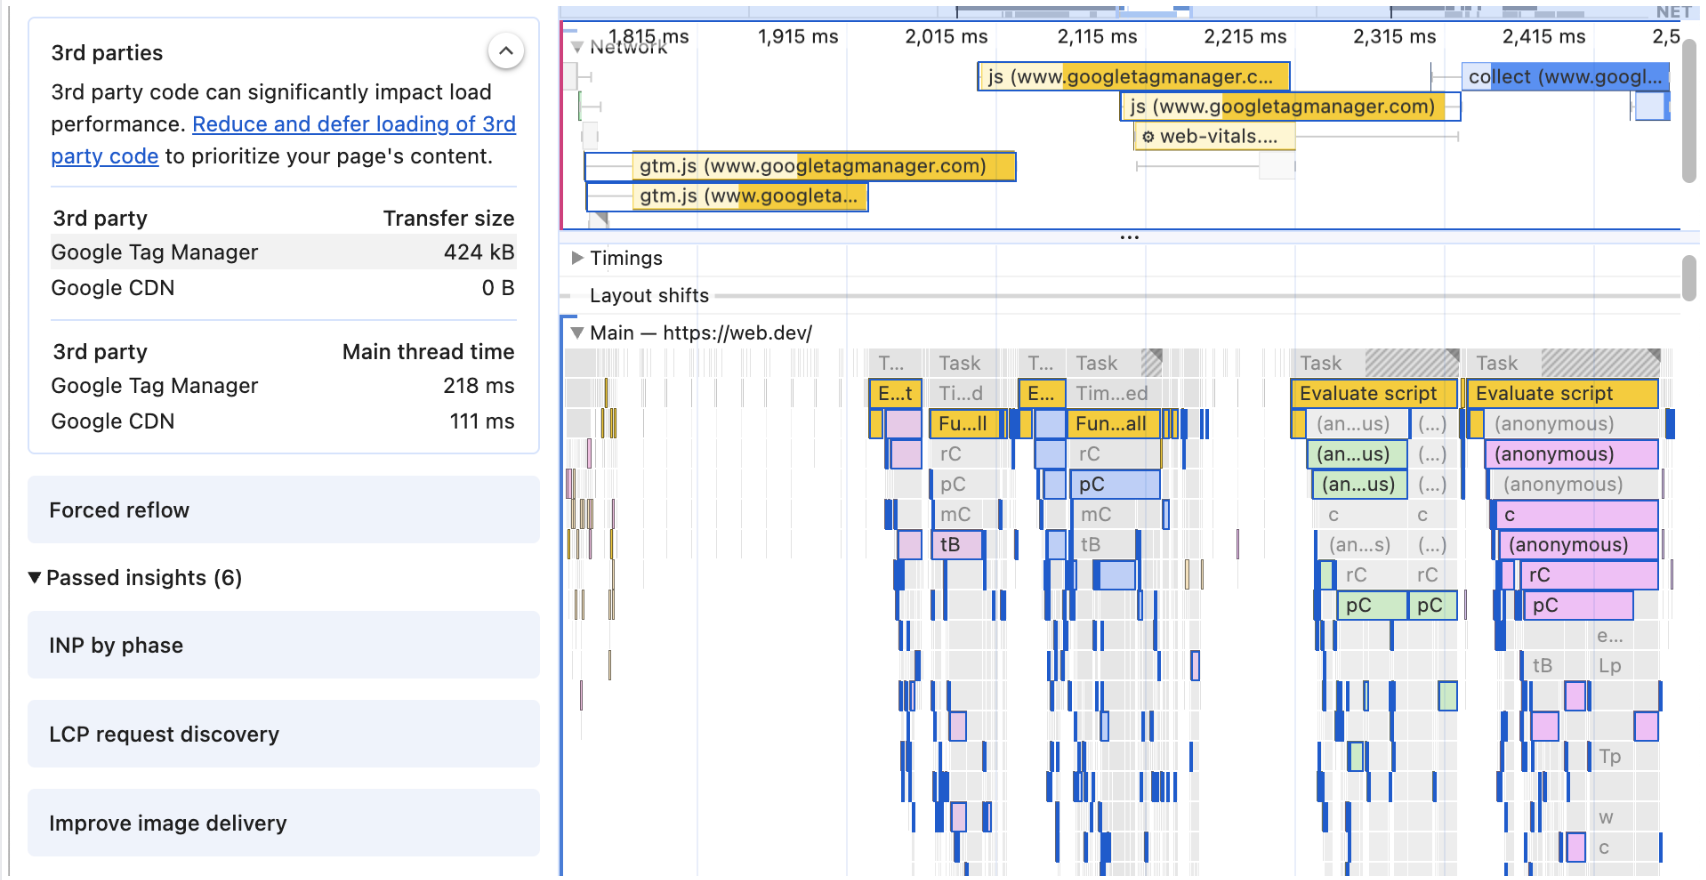
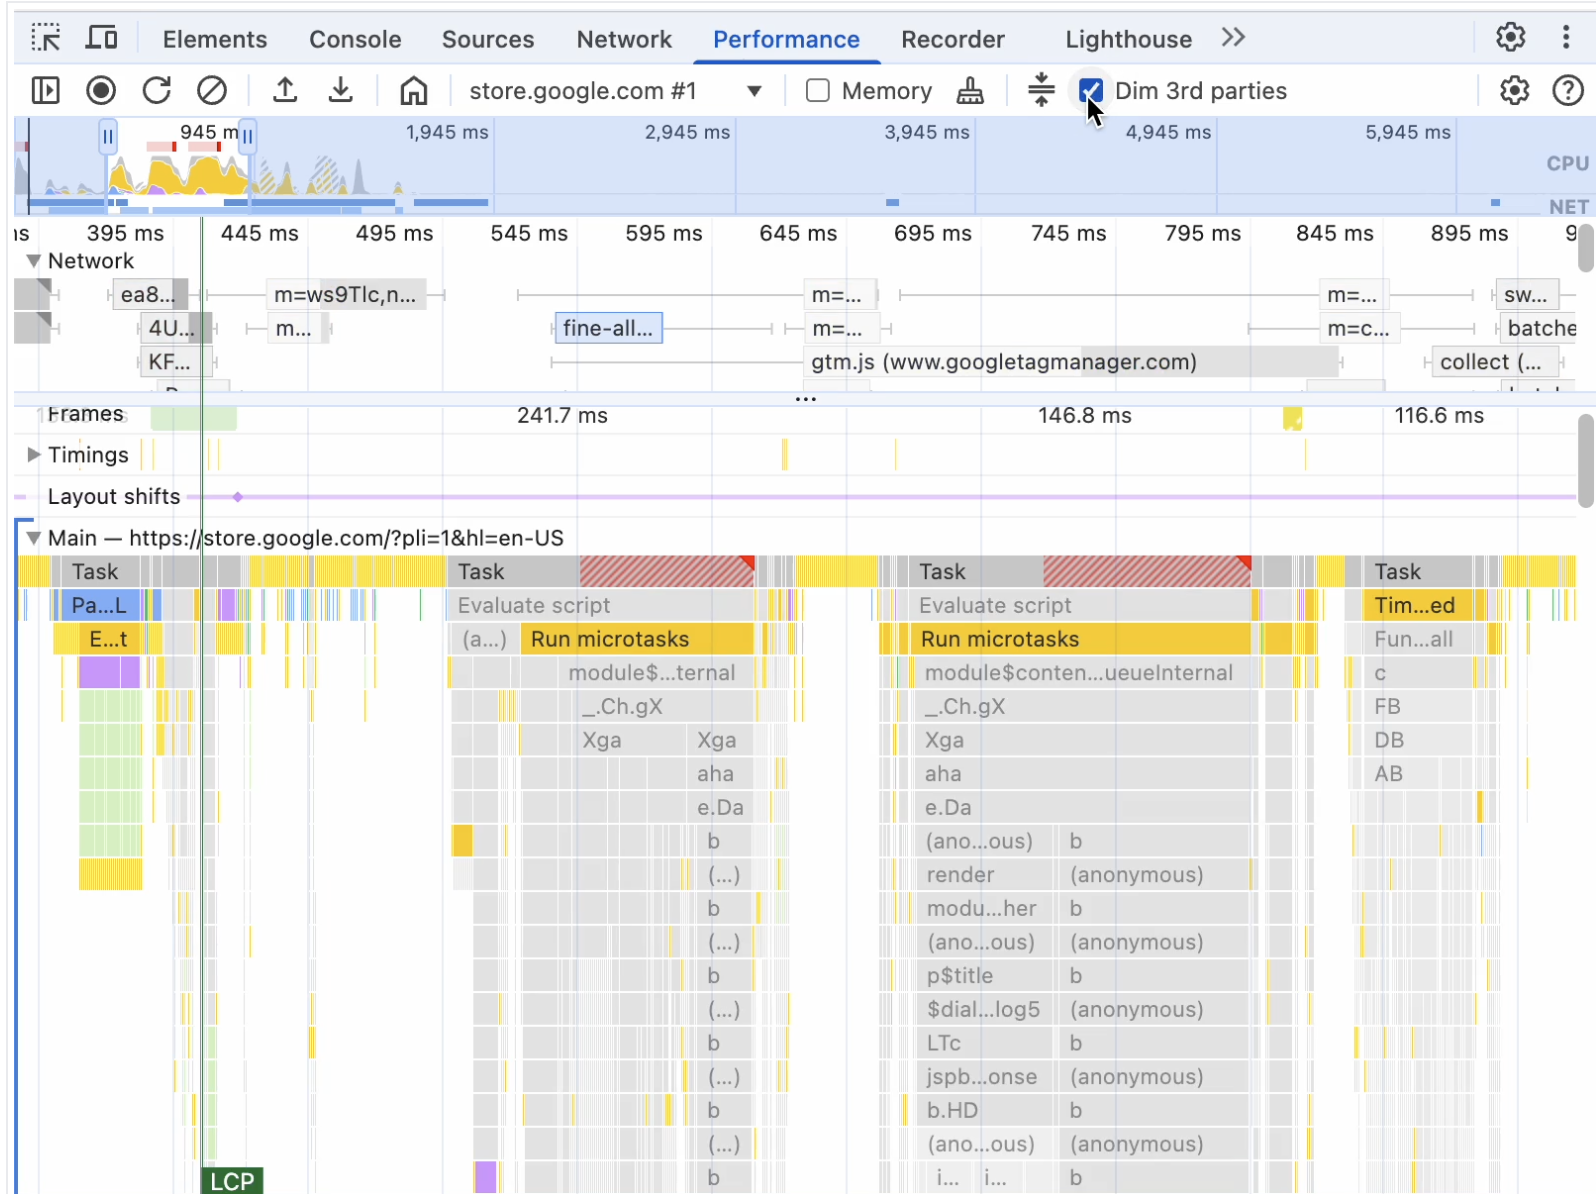
- Navigating & Filtering Information: The Performance panel provides a wealth of information that can be visually overwhelming and add friction for developers to navigate. In research sessions, we heard that they wanted more control over layers of information that could be surfaced or filtered away. To help developers visually parse & connect information , we added features to highlight items in the trace, distinguish between 1st & 3rd party data, and filter out irrelevant data. We also addressed long-standing requests to provide options for keyboard navigation & scrolling.
Our improvements to Performance debugging continue to be a highlight and keystone of our efforts to understand developer needs and ship user-centered products.

Leave a comment